How we measure poverty matters
Viewed over 20 years there’s been little sustained improvement in poverty rates in the UK. But, how should we measure being poverty, and does how we measure it make a material difference to who is seen as in poverty?
Anthony Barker looks at the new indicator developed by the Social Metrics Commission and how it changes the incidence of poverty from the long-established measure.
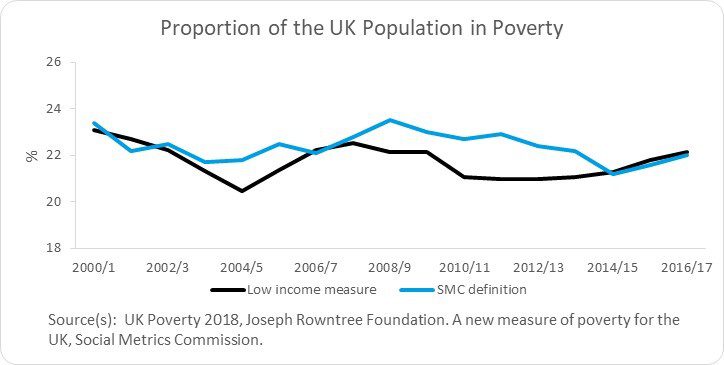
To date, the commonly-used definition of poverty is defined in terms of relatively low household income levels adjusted for housing costs[1]. On this (‘low income’) measure The Joseph Rountree Foundation concluded in their latest annual assessment of poverty in the UK, UK Poverty 2018, that more than 14 million people – that is more than one in five of the population – is living in poverty.
This measure of poverty is quite narrowly defined, around income (more than just earnings) and one source of inescapable cost – housing costs (albeit that this is (probably) the largest inescapable cost for a household).
The Social Metrics Commission has developed a new poverty metric intended to account for a wider range of unavoidable costs associated with personal circumstances, such as disability, as well as access to savings or other means to alleviate (if only temporarily) low incomes. Further, it includes those living on the streets and those in overcrowded housing that are not identified in the ‘low income’ measure.
So, how do the estimates of the number and nature of people in poverty compare?
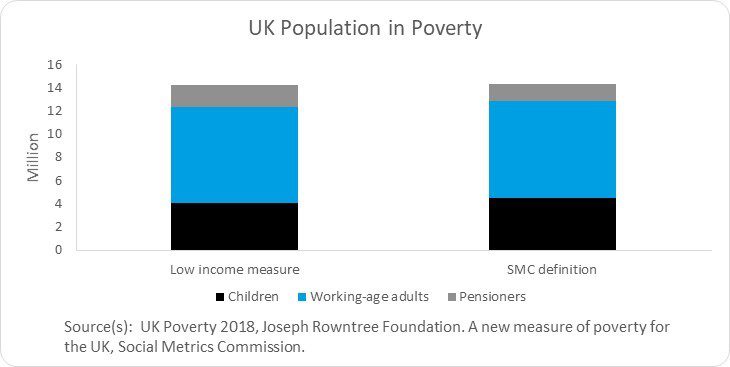
The headline numbers for people in poverty quoted in the JRF and SMC work are similar, though this is by design. The SMC want to focus attention on getting a better understanding of the types of households and individuals that make up the population in poverty. In their analysis they therefore set the threshold for being in poverty on its indicator to give a broadly similar headline number of people in poverty as the low-income measure.
The two measures show different underlying trends through the economic cycle since the recession in 2008. Taking a 20-year view, the SMC definition shows less volatility year-on-year (because it takes account of a wider range of factors than just income, many of which don’t change year-to-year), but neither series shows any sustained change in poverty rates.
Within the headline figure, the SMC indicator identifies fewer pensioners living in poverty but more children and adults of working age than does the low-income indicator. That fewer pensioners are identified in the SMC definition likely reflects that this group will have other savings on which they can draw to supplement pension income.
A more notable difference between the two definitions is that the SMC indicator identifies many more people to be in persistent poverty – that is in poverty this year and in two of the preceding three years – some 7.7m compared to just over 4.5m on the low-income measure.
Despite the refinements in the SMC measure, the vast majority (over 80%) of those identified as in poverty on the SMC indicator are also identified on the low-income measure.
So, what does this mean for policy?
On one level, the different definition of those in poverty does not have much impact on the broad focus of policy: as both measures see most people in poverty being working age adults, followed by children and then pensioners.
However, the SMC measure suggests the focus should move more to working-age households (both with and without children) and to households where someone has a disability, and less on measures to alleviate pensioner poverty.
With persistent poverty seen to be more entrenched the need for sustained support for those affected is even more important.
The details should not distract from the headline: more than one in five of the population live in poverty, and all the policy initiatives over the past 20 years have not produced a sustained improvement on this.
[1] Someone is in poverty if they are in a household with a net income (ie allowing for benefits, pensions, as well as national insurance and various tax payment) of less than 60% of the median value for their family type after housing costs have been deducted.
For more information about the content of this blog, or about Cambridge Econometrics’ work in inequality and poverty more generally please contact me: