Cambridge Econometrics Celebrates 40 Years of Delivering Impactful Independent Analysis
Cambridge Econometrics celebrates 40 years of impactful and independent analysis. With reflections from Richard Lewney, Phil Summerton and Jon Stenning.
cambridgeeconometrics
New Research Reveals Current Hydrogen Policies Insufficient to Meet Global Hydrogen Ambitions
Current hydrogen policies are insufficient to meet global hydrogen ambitions. Additional policies are needed to kickstart global green hydrogen production.
cambridgeeconometrics
greeningtheeconomy economicmodelling
New Report by Veterans Aid Reveals a Contribution of Up to £2.6m in Net Benefits for UK Society
An independent report illustrating the social and economic value of the work of an ex-service charity has confirmed that Veterans Aid’s interventions over the course of a year achieved net benefits of up to £2.6m.
cambridgeeconometrics
Ortec Finance Releases its 2025 Scenario Updates in Partnership with Cambridge Econometrics
Ortec Finance and Cambridge Econometrics release the 2025 climate scenario updates, revealing that the physical, transitional and market pricing risks related to climate change remain a major source of uncertainty for institutional investors.
cambridgeeconometrics
sustainableinvestment
Delivering the UK’s carbon targets by 2050 will involve structural shifts in the UK economy – and public policy has an essential role to play
Public policy is crucial for the UK to meet its carbon targets by 2050, ensuring a just transition and economic growth.
cambridgeeconometrics
greeningtheeconomy
Invest 2035: Top Priorities for the UK’s New Industrial Strategy Green Paper
Explore the UK Government's Invest 2035 strategy, focusing on industrial growth, strategic alignment, and identifying key sub-sectors for future economic success.
cambridgeeconometrics
greeningtheeconomy
Cambridge Econometrics Announces Chris Thoung as Chief Economist
Cambridge Econometrics appoints Chris Thoung as Chief Economist to enhance their economic analysis, modelling, and consultancy services, driving innovation and technical capability for high-quality policy solutions.
cambridgeeconometrics
Cambridge Econometrics Announces Jon Stenning as Deputy CEO
Cambridge Econometrics appoints Jon Stenning as Deputy CEO to lead economic analysis, enhance client service, and drive impactful collaborations.
cambridgeeconometrics
Fiona Fernandez Joins Cambridge Econometrics as Head of HR
Fiona Fernandez joins Cambridge Econometrics as Head of HR, bringing 25 years of HR expertise to support and invest in the company's people and growth.
cambridgeeconometrics
Dr Simone Cooper-Searle Joins Cambridge Econometrics
Dr. Simone Cooper-Searle joins Cambridge Econometrics as Head of Global Environment Division, bringing 15 years of expertise in energy transition and climate change mitigation.
cambridgeeconometrics
Ortec Finance Releases Its 2024 Climate Scenario Updates in Partnership With Cambridge Econometrics
Ortec Finance's 2024 Climate Scenario updates, made with Cambridge Econometrics, help investors assess climate change impacts on portfolios, incorporating the latest policies, El Niño effects, and various climate futures.
cambridgeeconometrics
sustainableinvestment
New Economic Analysis Reveals Long COVID Could Be a Long-Term Drag On Economic Growth and Add Pressure to Already Strained NHS
Long Covid could significantly impact the UK's economy and NHS, reducing GDP and increasing job losses without long-term healthcare funding.
cambridgeeconometrics
impactassessment
Decarbonization Initiatives Would Generate Significant Benefits to Florida’s Economy
Decarbonization in Florida promises economic growth, job creation, and consumer savings through strategic clean energy investments, achieving a 2% larger economy by 2050.
cambridgeeconometrics
greeningtheeconomy
Cambridge Econometrics Celebrates 5 Consecutive Years as One of Financial Times’ UK Leading Management Consultants
Cambridge Econometrics celebrates five consecutive years as one of the UK’s leading management consultants, recognized for excellence in Data Analytics & Big Data.
cambridgeeconometrics
New Impact Assessment Report Accompanies EU Commission Recommendations for a 90% Emissions Reduction Target by 2040
EU Commission recommends a 90% emissions reduction target by 2040, supported by a detailed Impact Assessment and advanced economic models like Cambridge Econometrics’ E3ME.
cambridgeeconometrics
impactassessment
Cambridge Econometrics partners with Comfama to support regional competitiveness in Antioquia, Colombia
Cambridge Econometrics partners with Comfama to boost Antioquia's economic competitiveness, enhancing regional quality of life through innovative projects and strategic collaboration.
cambridgeeconometrics
regionaleconomicdevelopment
State of the City Report Paints a Data Picture of Cambridge
New report on Cambridge offers insights into social, environmental, and economic aspects, aiding informed discussions for future improvements. Explore the data on the city council's website.
cambridgeeconometrics
regionaleconomicdevelopment
Keeping 1.5°C Alive: Credible Policies and Innovation Can Take Us There
Achieving the 1.5°C climate target is possible with credible policies, financial commitment, and innovation, despite challenges and investment gaps. Discover how we can make it happen.
cambridgeeconometrics
sustainableinvestment
Is the Uptake of Green Technologies the Answer to Southeast Asia’s High Youth Unemployment?
Can green technologies reduce Southeast Asia's youth unemployment? Discover how green jobs could benefit young, skilled workers and boost GDP in our latest analysis.
cambridgeeconometrics
futureofwork
Three Policies for a Just and Gender Inclusive Economic Recovery From COVID-19
Policies for a fair and gender-inclusive economic recovery from COVID-19: boosting care services, closing the gender wage gap, and ensuring equitable household transitions.
cambridgeeconometrics
futureofwork
E3ME Considered Among Top Five Macroeconomic Models for Integrating Climate Risk Into the President’s Budget
E3ME model, recognized by the White House, integrates climate risk into macroeconomic forecasts, aiding policy and investment decisions with state-level insights through the E3-US model.
cambridgeeconometrics
economicmodelling
Cambridge Econometrics Recognised in Financial Times Leading Management Consultants 2023
Cambridge Econometrics is honoured to be recognised by the Financial Times as a leading UK management consultant for the fourth consecutive year.
cambridgeeconometrics
Cambridge Econometrics Accredited Silver Award for Investors in People
Cambridge Econometrics celebrates retaining its Silver Award for Investors in People, reflecting its dedication to fostering a supportive and dynamic workplace.
cambridgeeconometrics
New Research Reveals Net Zero Policies Can Help Tackle Poverty and Drive Economic Growth in the UK
New research reveals accelerating the roll out of heat pumps, electric vehicles and home insulation measures could help alleviate fuel and transport poverty in the UK, while supporting the government’s growth agenda.
cambridgeeconometrics
greeningtheeconomy
Mercer Collaborates with Ortec Finance and Cambridge Econometrics on Climate Crisis Portfolio Modelling
Mercer has entered a global collaboration with strategic partners Ortec Finance and Cambridge Econometrics to understand climate-related risk for investment portfolios.
cambridgeeconometrics
sustainableinvestment
New Coal Impact Research Shows Strong Position for Appalachian Georgia Region to Apply for POWER Funding
Cambridge Econometrics analysis for the Georgia Department of Community Affairs reveals a strong position for the Appalachian region and communities to apply for POWER funding.
cambridgeeconometrics
regionaleconomicdevelopment
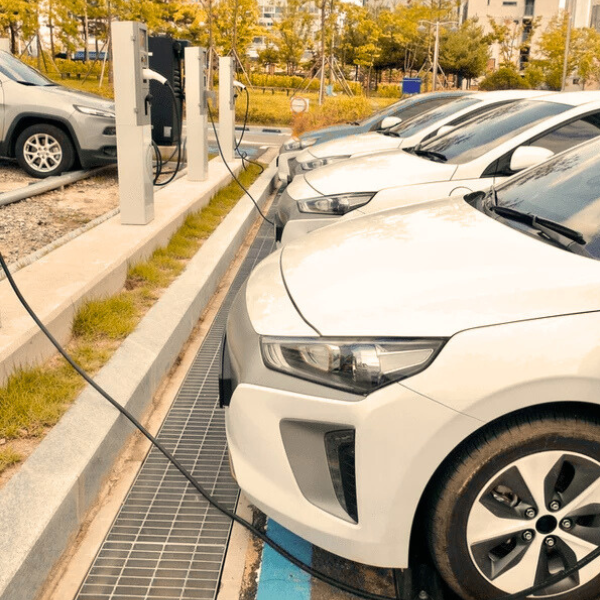
An Ambitious ICE Phase-Out in Korea Would Reduce Emissions and Create Long-Term Economic Growth
A new report by Cambridge Econometrics for Greenpeace East Asia Seoul Office reveals an accelerated deployment of EVs would lead to a substantial reduction in emissions, while creating jobs and long-term economic growth.
cambridgeeconometrics
greeningtheeconomy
New Analysis Shows Energy Efficient Buildings Are Central to Successful Climate Action
Analysis by Cambridge Econometrics shows that energy efficient buildings are a pre-condition for successful climate action, backed by strong public support revealed through polling carried out across five countries by OnePoll.
cambridgeeconometrics
policyevaluation
Cambridge Econometrics Opens for Business in North America
Cambridge Econometrics announces the formation of Cambridge Econometrics Inc., specializing in the provision of economic consulting services for the North American market, bringing expertise and new modeling capacity to a broad range of clients
cambridgeeconometrics
Cambridge Econometrics Informs the European Commission’s ‘Fit for 55 by 2030’ Package
Cambridge Econometrics analysis informs the European Commissions' Fit for 55 by 2030’ package.
cambridgeeconometrics
policyevaluation
Rapid Decarbonisation of Heat and Transport Sectors Could Lead to Positive Economic Impact for Europe
A report by Cambridge Econometrics shows that rapid decarbonisation in heat and transport sectors could lead to positive macroeconomic impact for Europe, but it must be designed carefully to avoid putting a disproportionate burden on low-income households.
cambridgeeconometrics
policyevaluation
How Will the Gender Employment Gap Fare in the Age of Automation?
Madalina Suta explores how automation and Covid-19 impact the gender employment gap, and whether these factors could accelerate or delay achieving gender equality in the EU.
cambridgeeconometrics
futureofwork economicmodelling
Investing in Nature-Based Solutions Can Help Rebuild a Stronger and Greener Economy
A report for RSPB reveals that investing in nature-based solutions can drive economic growth, create jobs, and help the UK achieve its net zero emissions targets and biodiversity goals by 2050.
cambridgeeconometrics
greeningtheeconomy
2030 Ban on Polluting Cars Could Create Over 30,000 Jobs and Provide £4.2bn Boost to the Economy
2030 ban on polluting cars in the UK could create 30,000+ new jobs and boost the economy by £4.2bn, according to a Cambridge Econometrics report.
cambridgeeconometrics
impactassessment
Green Recovery Plans More Effective Than Return-To-Normal Stimulus
New analysis shows that green recovery plans boost income, employment and GDP better than return-to-normal stimulus measures, with the added benefit of reducing emissions.
cambridgeeconometrics
economicmodelling
China’s Net Zero Ambition Could Boost GDP by 5% During this Decade
China's net zero target could boost its GDP by 5% this decade, reduce global warming, and lower green energy costs, according to economic modelling analysis run by Cambridge Econometrics.
cambridgeeconometrics
economicmodelling